Viewers and Reports
Incorporated into each of the SIDE-derived products are an extensive array of tools for the presentation, interpretation and output of the solution results. The large amount of organized data allows not only the formulation of detailed performance conclusions, but also documents the progression of the physical processes that constrained and contributed to that solution.
Block Diagram Viewer shows
- Input/Output Viewer (hierarchical tree diagram contains all the input and output values of the solution process in an organized fashion. The User can delve deep into the subset values to find very detailed information, for example, the gas properties of the flow entering the combustor)
- Parametric design - Inputs can be changed to create a new design
- Plotting components built-in - such as 3D Geometry Viewers (OpenGL)
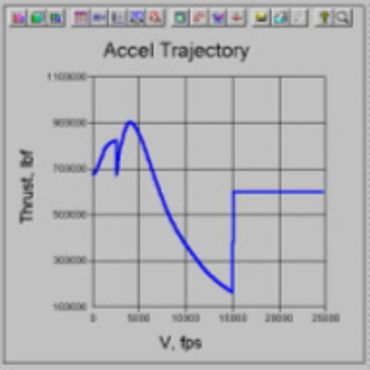
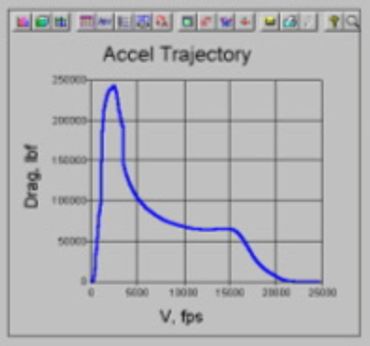
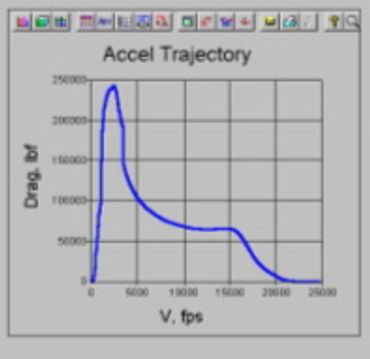
- Trajectory X-Y Plot (X-Y plot of any combination of over 2 dozen parameters, such as altitude, velocity, phi, propellant weight, mass flow rates, and time)
- Trajectory Animation
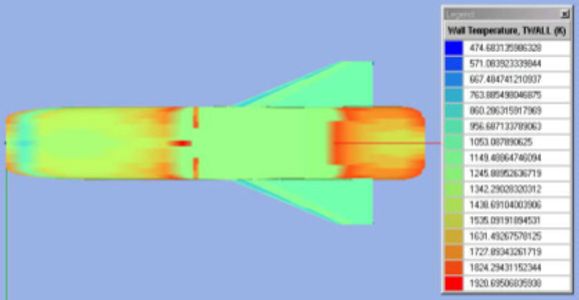
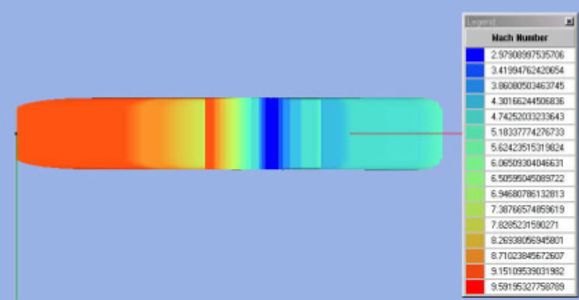
- Contour Plotting (visual plotting of dozens of parameters such as Mach #, Wall temperature, Cooling regions, boundary layer thickness and Pressure)
- Trade Study capability built in
- Report Makers built in for both MKS and FPS units - such as Detailed Weight Statements; Volume and Wetted Area reports, Active and Passive Cooling Areas, and Heating Statements
- Will create geometry outputs for Tecplot and Rhino3D
- Will create IGES file for CAD package such as Pro-E
- User friendly graphical interface
- Expandable
These capabilities are fully included in HySIDE, SuperSIDE and SpaceSIDE.
Copyright © 2019 Astrox Corporation - All Rights Reserved.